Community Health Profile
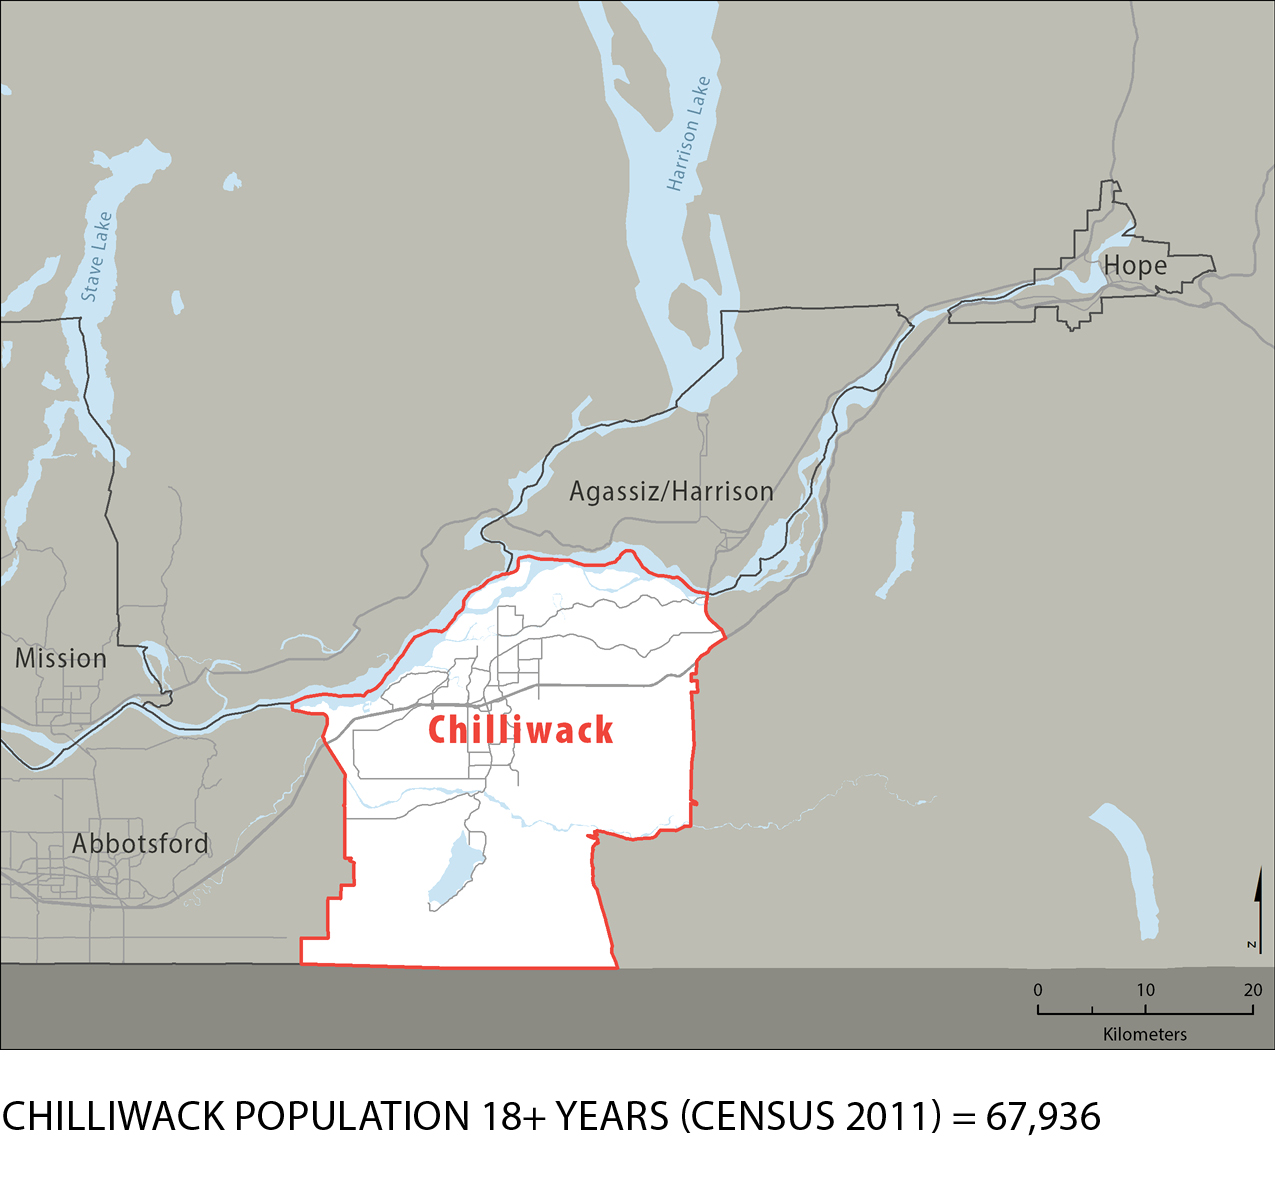
Chilliwack
Community Health Profile
Chilliwack
This report provides an overview of health and wellness in Chilliwack that will give residents, community agencies and local governments a better understanding of the factors influencing health in their community. Our hope is that this information will help spark community level dialogue on actions to create health promoting environments and reduce health inequities.
Highlights
- The community fares very well compared to the rest of the Fraser Health region for access to primary care.
- In contrast, Chilliwack performs worse than the Fraser Health average for the majority of healthy built environment indicators.
- Health status and behaviour indicators tend to cluster around the Fraser Health average, but in a few cases were much worse (prevalence of chronic breathing conditions and obesity).
- Chilliwack’s Healthier Community Partnership plans to improve local health and wellness focus on homelessness, stigmatization related to mental health, access to services for older adults and community safety.
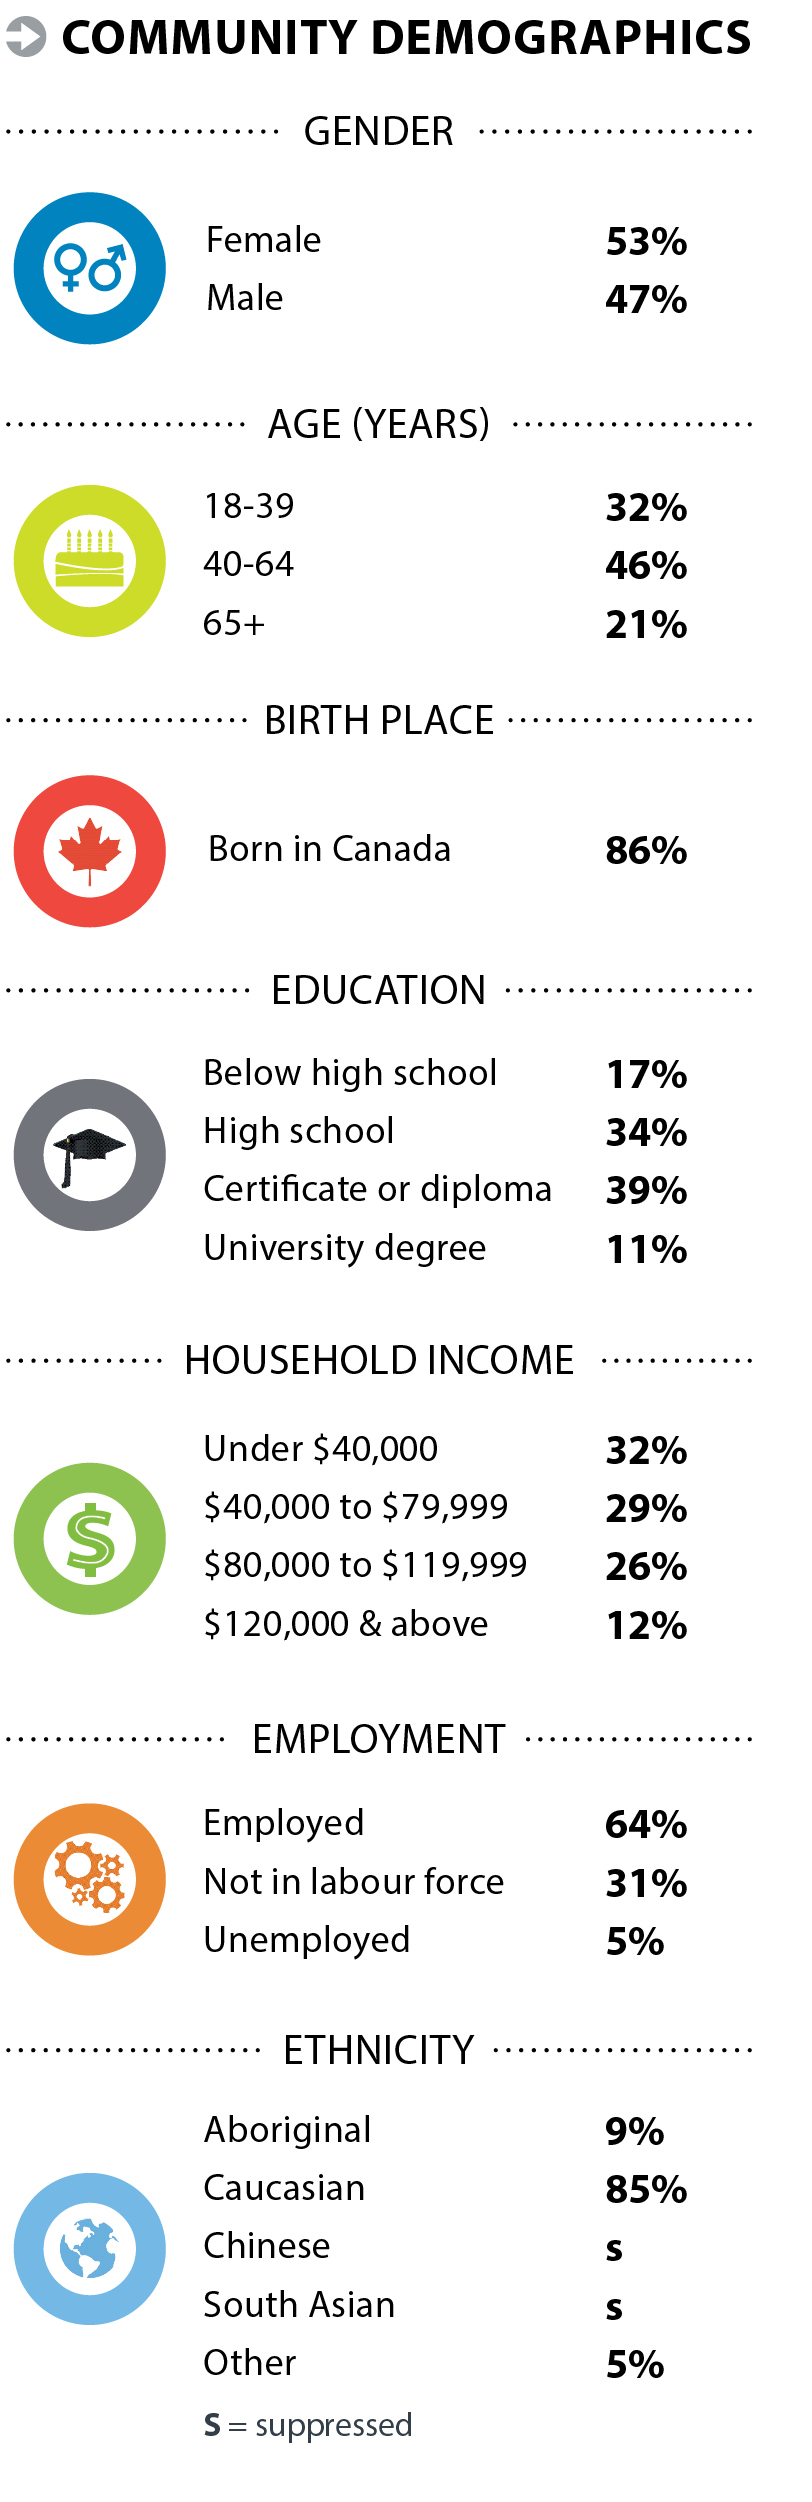
Community Demographics
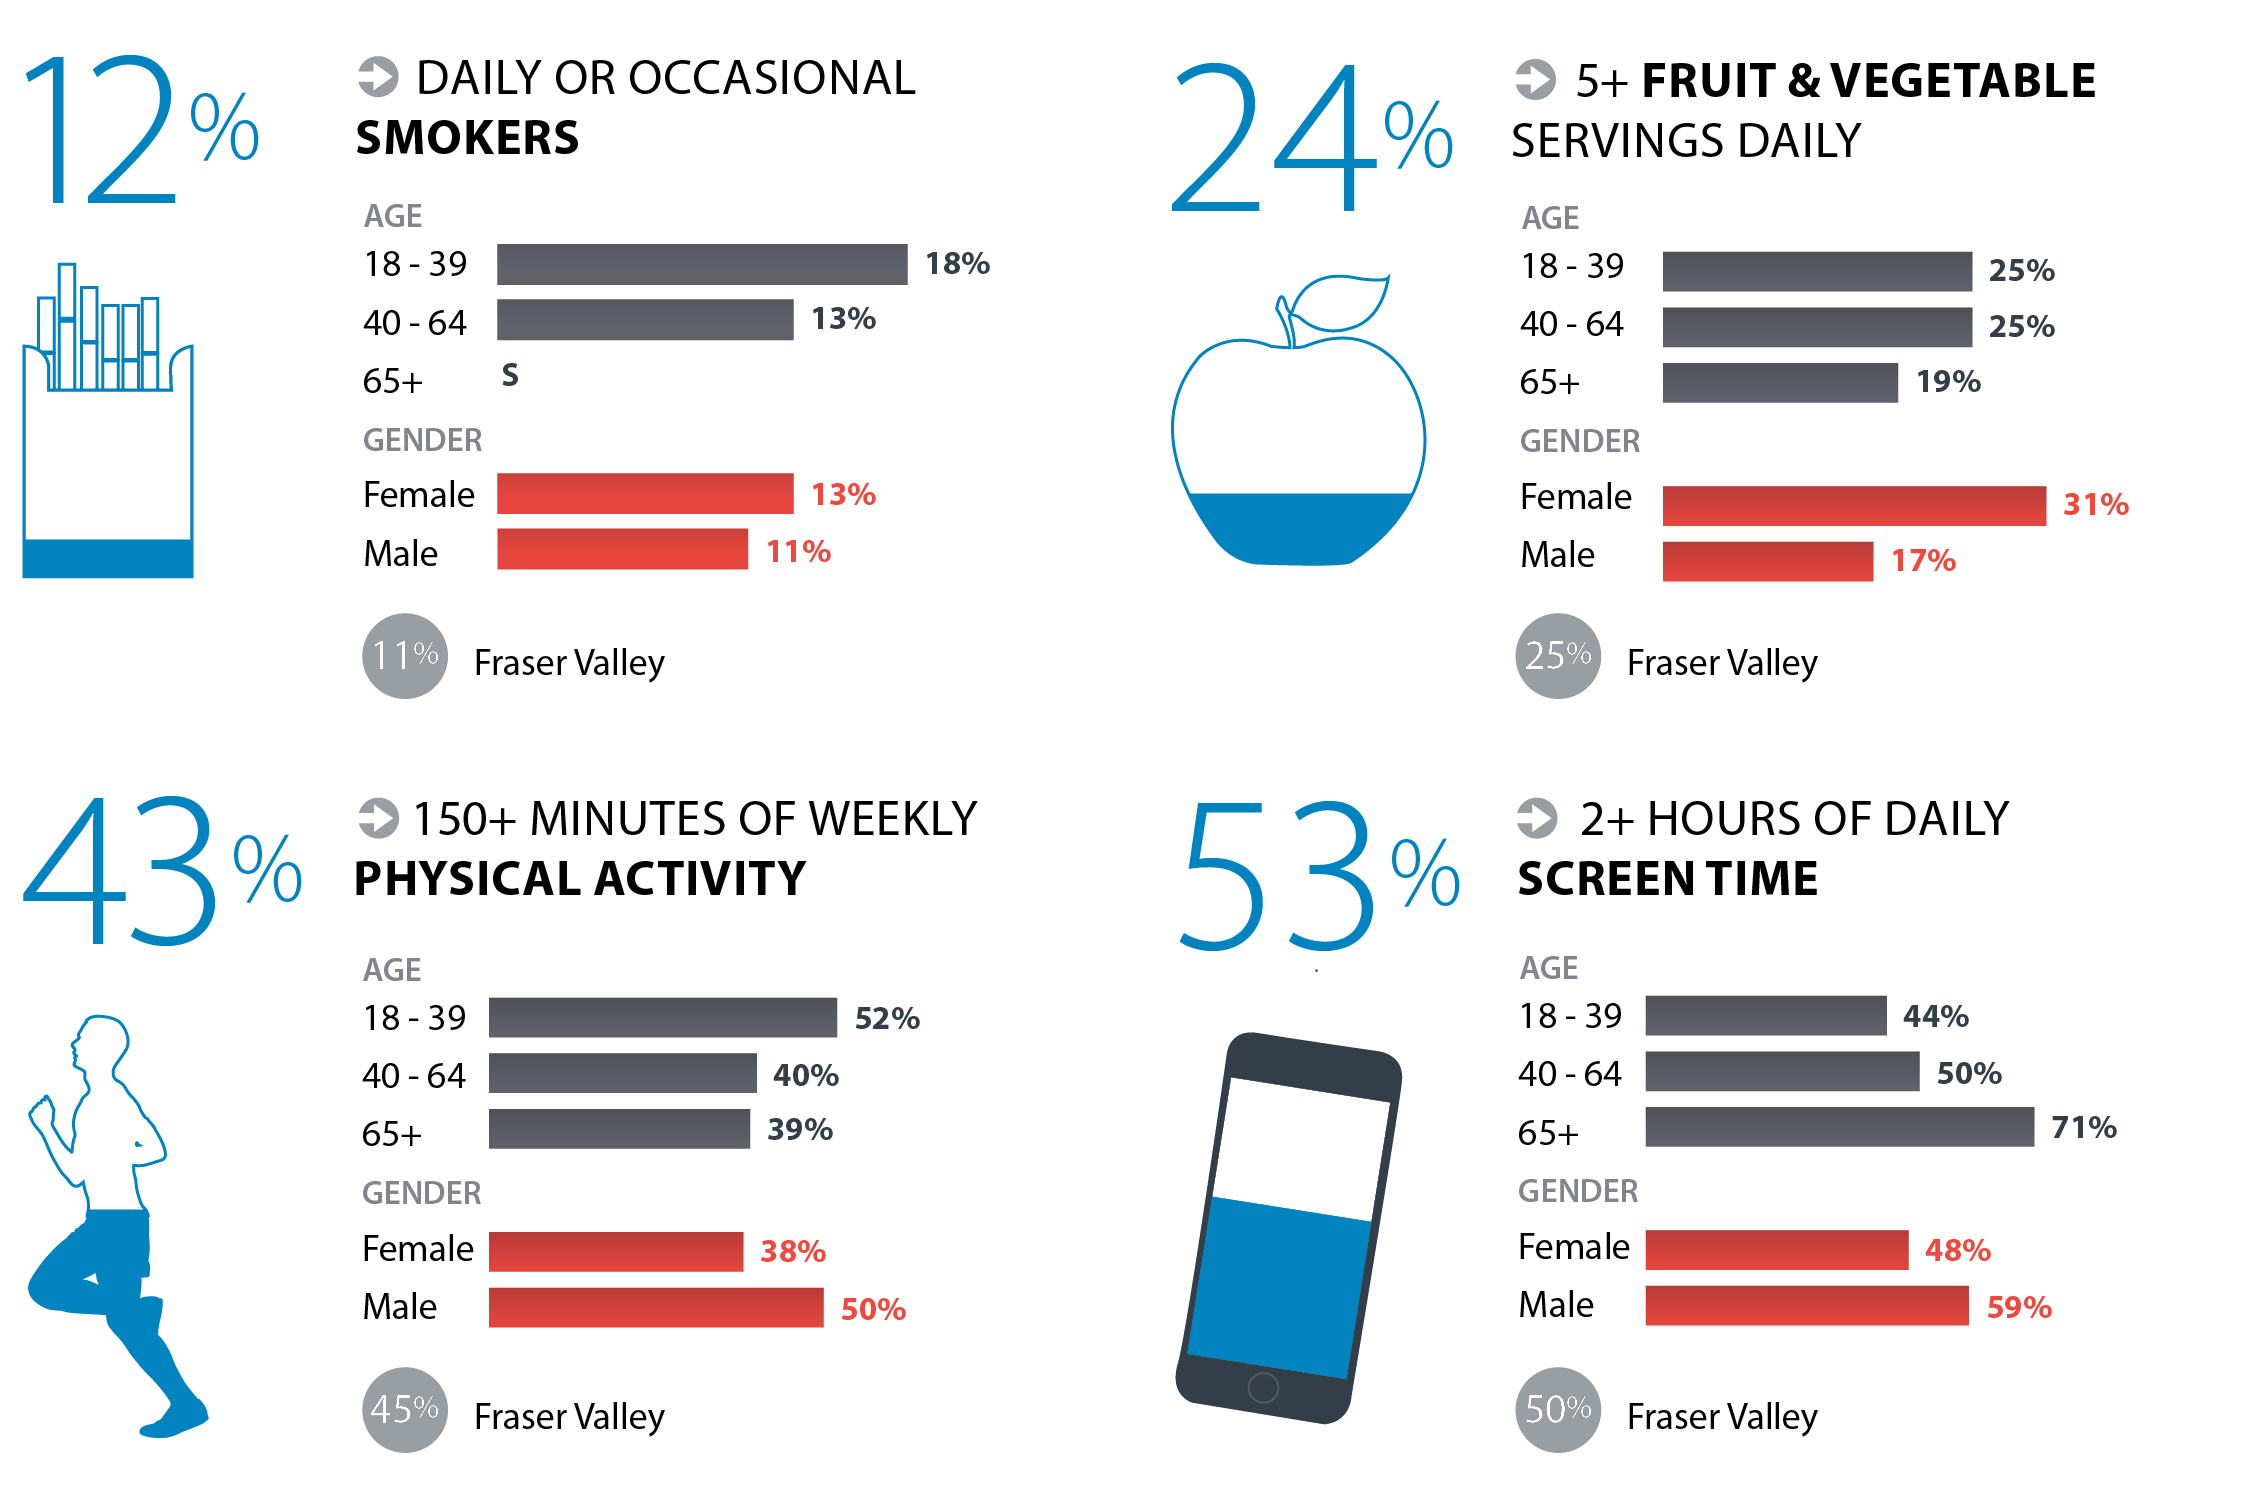
Healthy Behaviours
Healthy behaviours contribute to maintaining physical and mental health, and reducing the risk of chronic conditions such as heart disease, diabetes and stroke. Recommended lifestyle behaviours include (but are not limited to) consumption of 5 or more servings of fruits and vegetables per day, limiting harmful alcohol consumption, avoiding smoking, exercising moderately to vigorously for 150 or more minutes per week, and reducing screen time and other sedentary activities.
Healthy behaviours are shaped by individual choices, social and economic conditions and neighbourhood design. Community programs and policies can encourage and enable healthy behaviours and reduce the burden of chronic conditions in our communities.
Across Fraser Valley
- Compared to immigrants, Canadian born were 60% more likely to eat 5+ servings of fruits and vegetables daily and 70% more likely to be smokers.
- Healthy behaviours were higher among people with an annual household income greater than $120,000. They were almost 40% less likely to smoke, almost 25% more likely to meet physical activity recommendations and have daily consumption of 5+ servings of fruits and vegetables, and 50% less likely to report 2+ hours daily screen time compared to those with a household income less than $40,000.
- Healthy behaviours were higher among university graduates compared to those with less than high school education. Among university graduates smoking was 70% lower, daily consumption of 5+ servings of fruits and vegetables was 2.5 times higher, and reporting 2+ hours of screen time was 40% lower.
- Healthy behaviours differed by ethnicity. Compared to the Fraser Valley average of all ethnicities, smoking was 3 times higher among Aboriginal people, daily consumption of 5+ servings of fruits and vegetables was 60% lower among South Asians and reporting 2+ hours of screen time was 25% higher among Chinese.
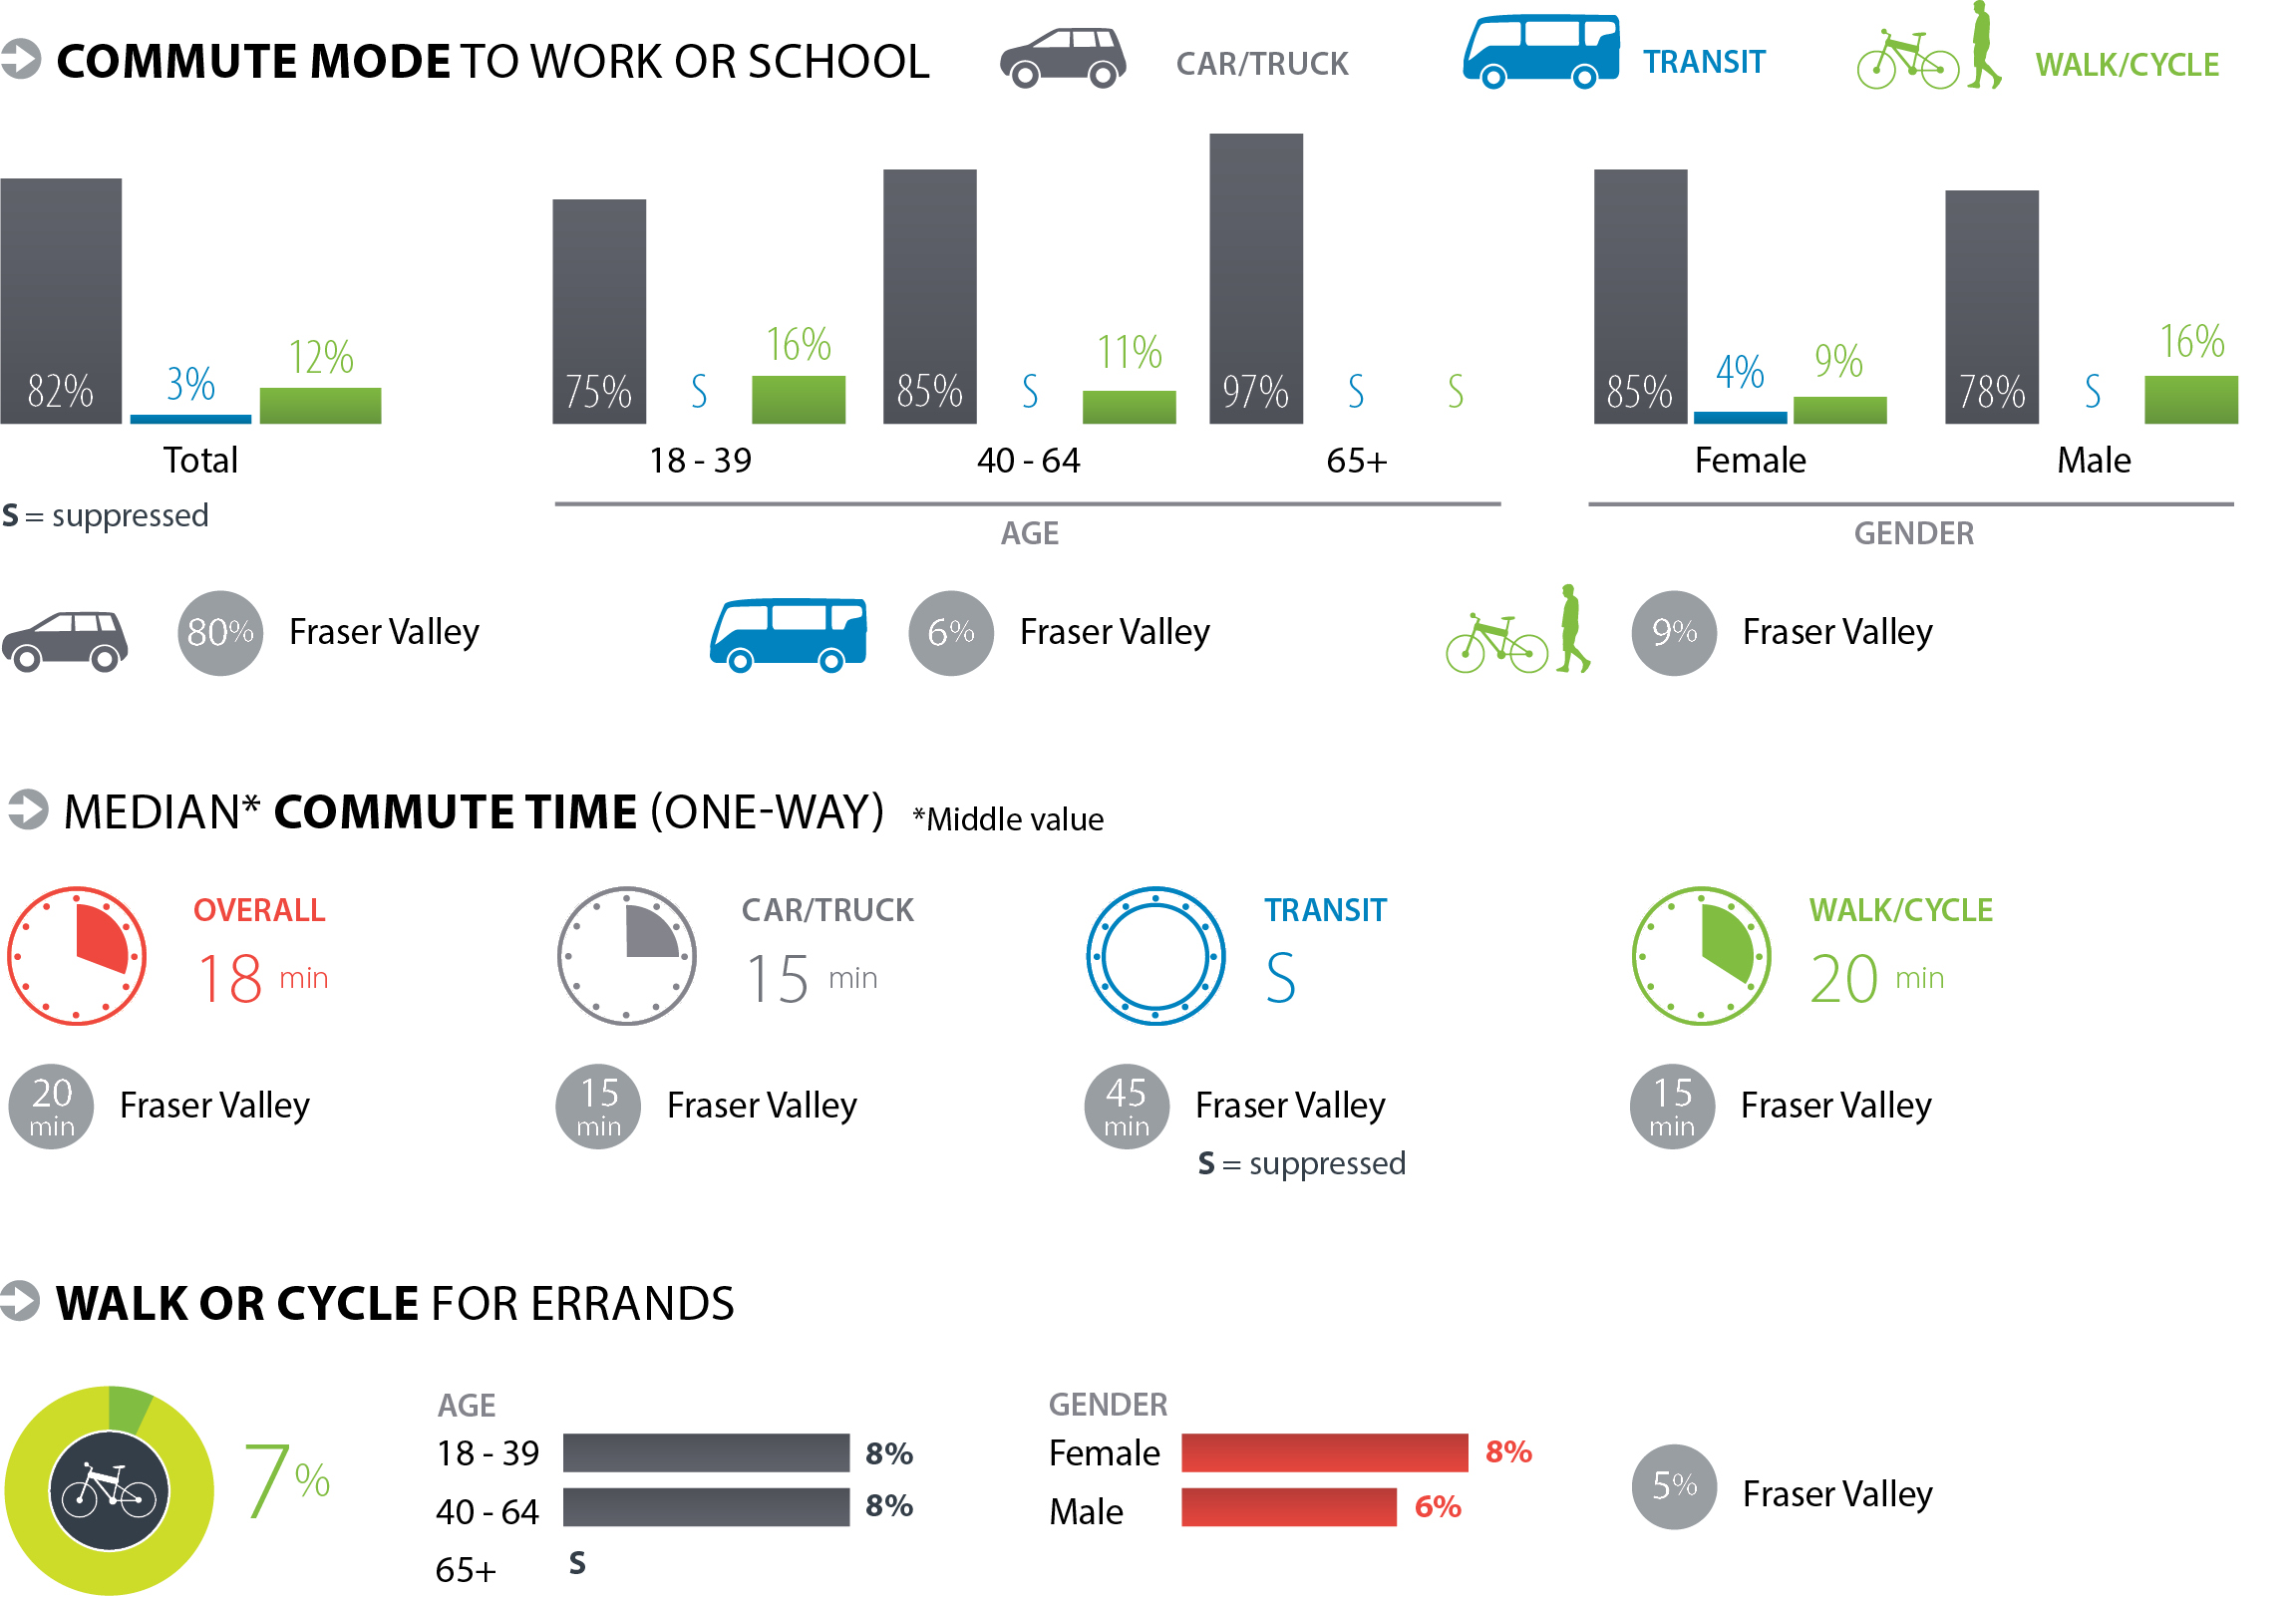
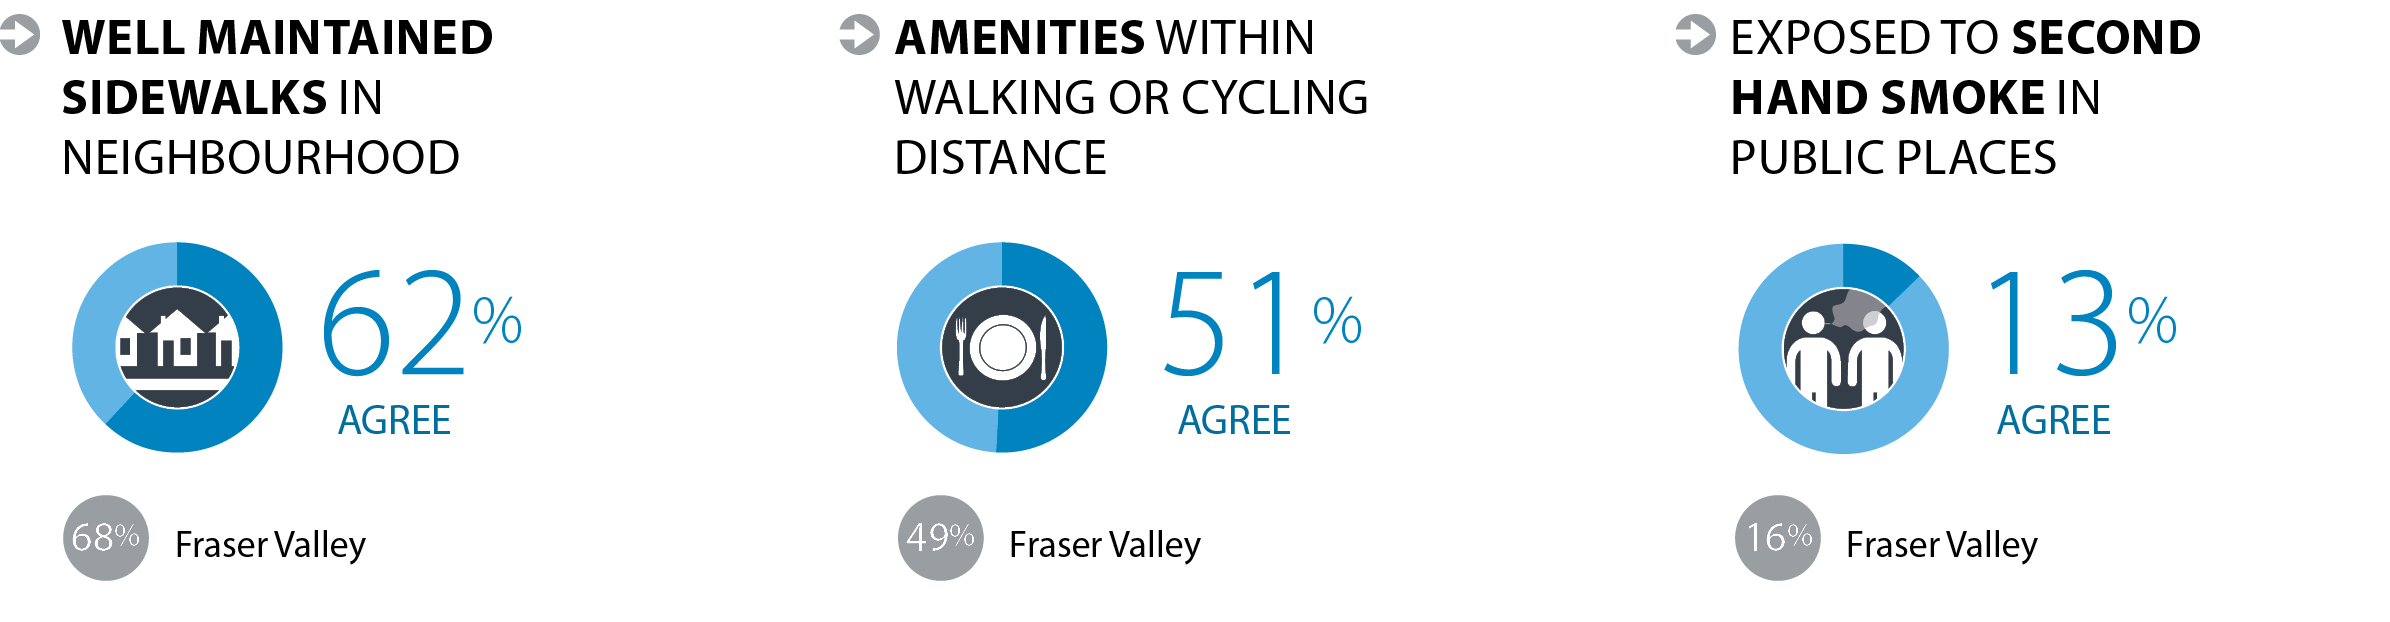
Built Environment
The physical environment in which we live, work and play impacts our health. Physical components of a built environment include neighbourhood design, transportation networks, natural environment, healthy food systems and housing. Community design influences community connectedness, mental and physical health, and chronic disease outcomes by promoting healthy behaviours such as walking or cycling. Healthy built environments are a shared responsibility and require the combined efforts of community agencies, health and social services and various levels of government.
Across Fraser Valley
- Compared to Canadian born, commuting by walking/cycling was 90% higher among recent immigrants.
- Compared to those with an annual household income of $120,000+, commuting by transit was 4 times higher and walking/cycling was 6 times higher among those with a household income less than $40,000. Second hand smoke exposure in public places was 2.5 times higher among those with a household income less than $40,000 compared to an income of $120,000+.
- Among those with less than high school education, commuting by transit was 5 times higher and walking/ cycling was 2 times higher compared to university graduates. Exposure to second hand smoke in public places was 45% lower among university graduates compared to those with less than high school education.
- Among all ethnicities, Caucasians had higher use of cars as the main mode of commute. Compared to the Fraser Valley average, exposure to second hand smoke in public places was 2 times higher among both Aboriginal and Chinese people.
Community Resiliency
Support from families, friends and communities is associated with better health as it helps people deal with challenges and overcome problems. Supportive communities provide environments in which people are able to make decisions to improve their health and engage in healthy behaviours.
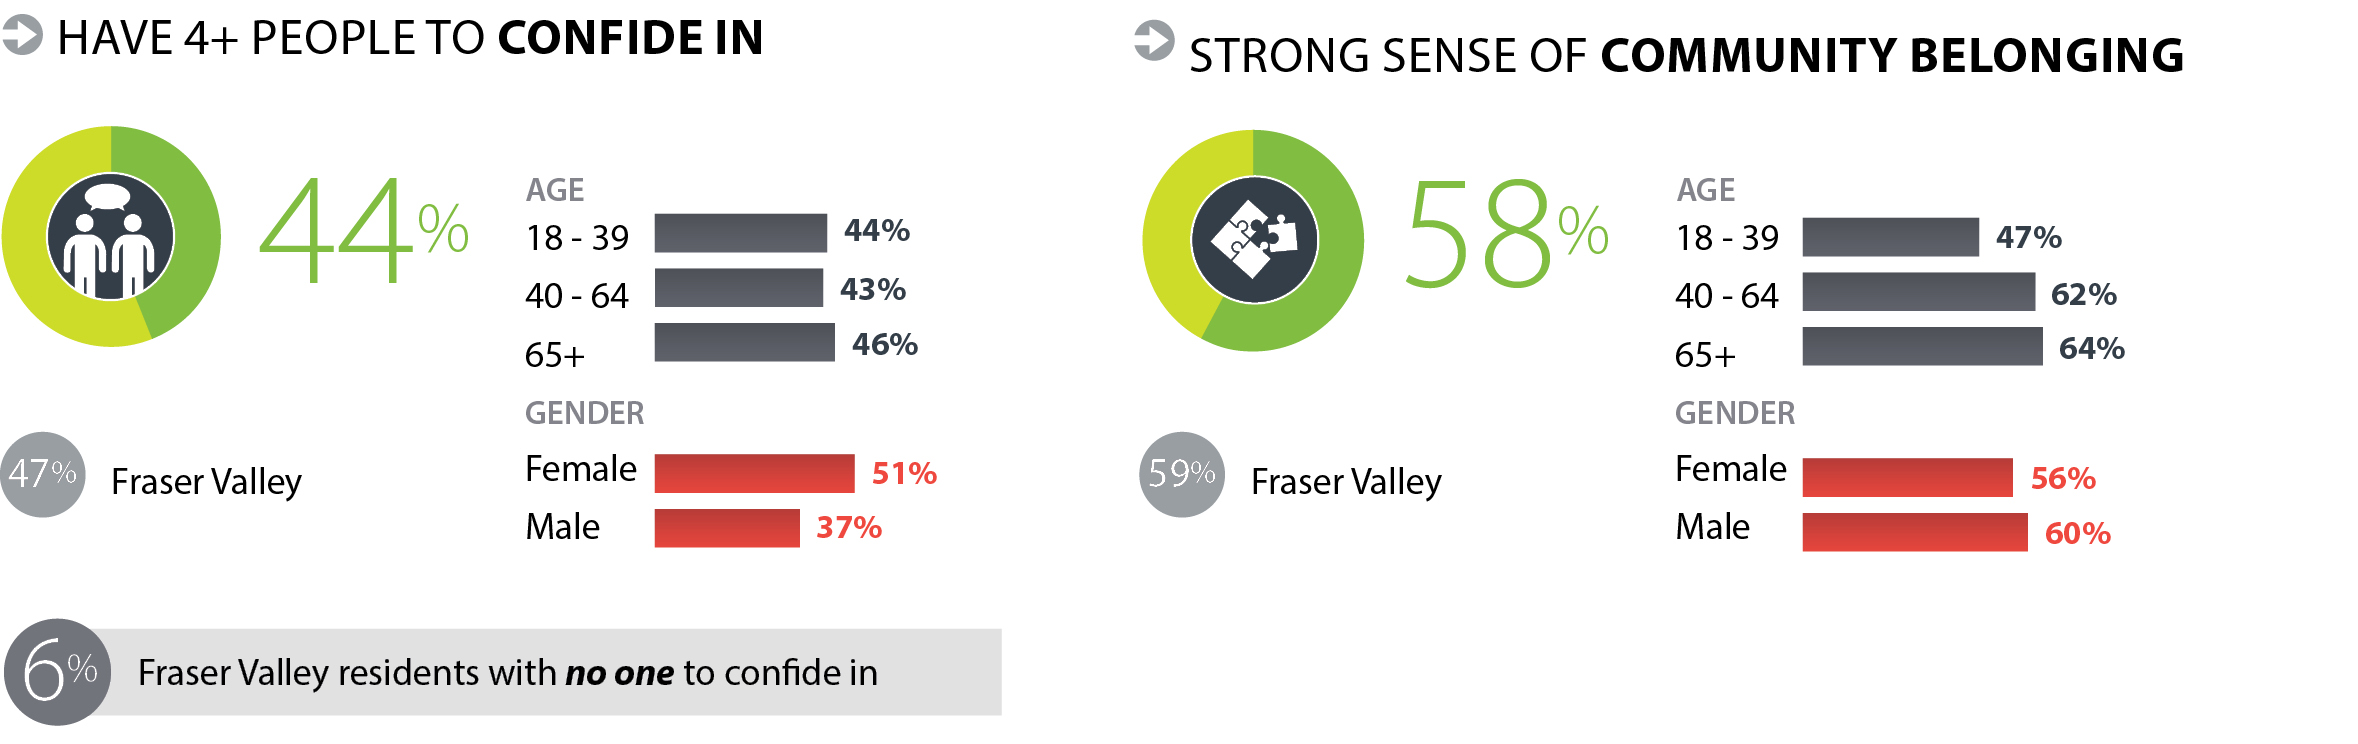
Across Fraser Valley
- Sense of community belonging and having 4+ people to confide in did not differ significantly by immigration status.
- Those with an annual household income of $120,000+ were 45% more likely to report having 4+ people to confide in compared to those with an income of less than $40,000.
- Sense of community belonging and having 4+ people to confide in did not differ significantly by level of education.
- Compared to regional average, strong sense of community belonging was 35% higher among South Asians.
Family Doctor
Having a family doctor plays an important role in maintaining health and preventing chronic illness. Regular contact with a health care provider ensures that recommended preventive services, like screening for early stages of disease, is timely and that chronic conditions are well-managed to prevent complications. Having a regular care provider also helps to maintain continuity of care.
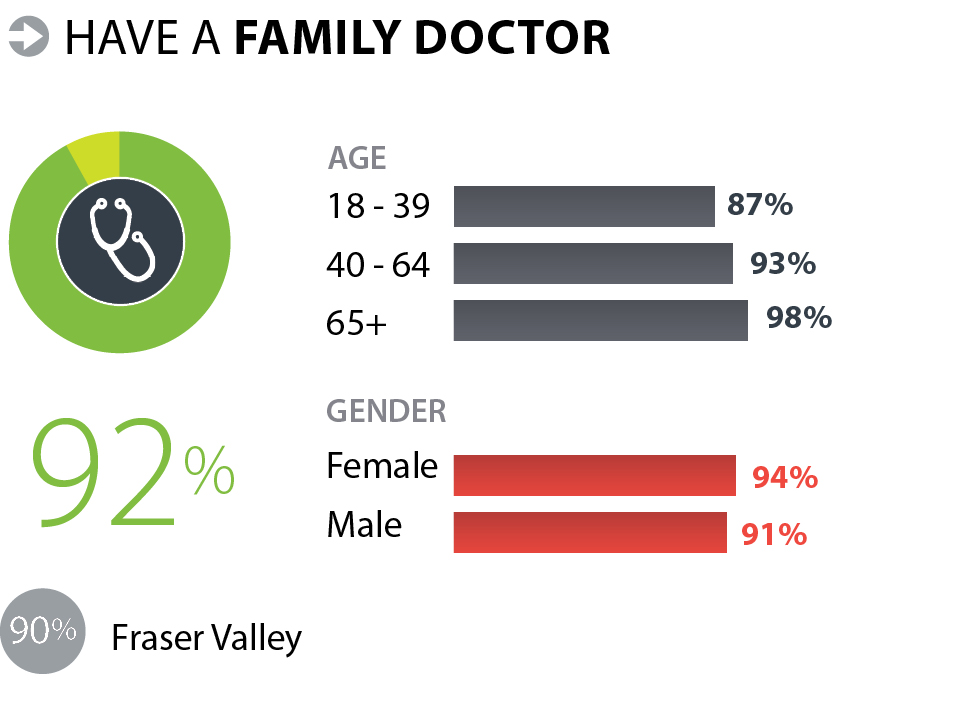
Across Fraser Valley
- Having a family doctor did not differ significantly by level of education.
- Respondents with an annual income of $120,000+ were 10% more likely to have a family doctor compared to those with a household income less than $40,000.
- Compared to Canadian born, having a family doctor was 30% lower among recent immigrants.
Health Status
Our physical and mental health is influenced by lifestyle behaviours, access to health services, the built environment, and our social and economic situation. Self-rated health is considered to be a good measure of the general health status of a population.
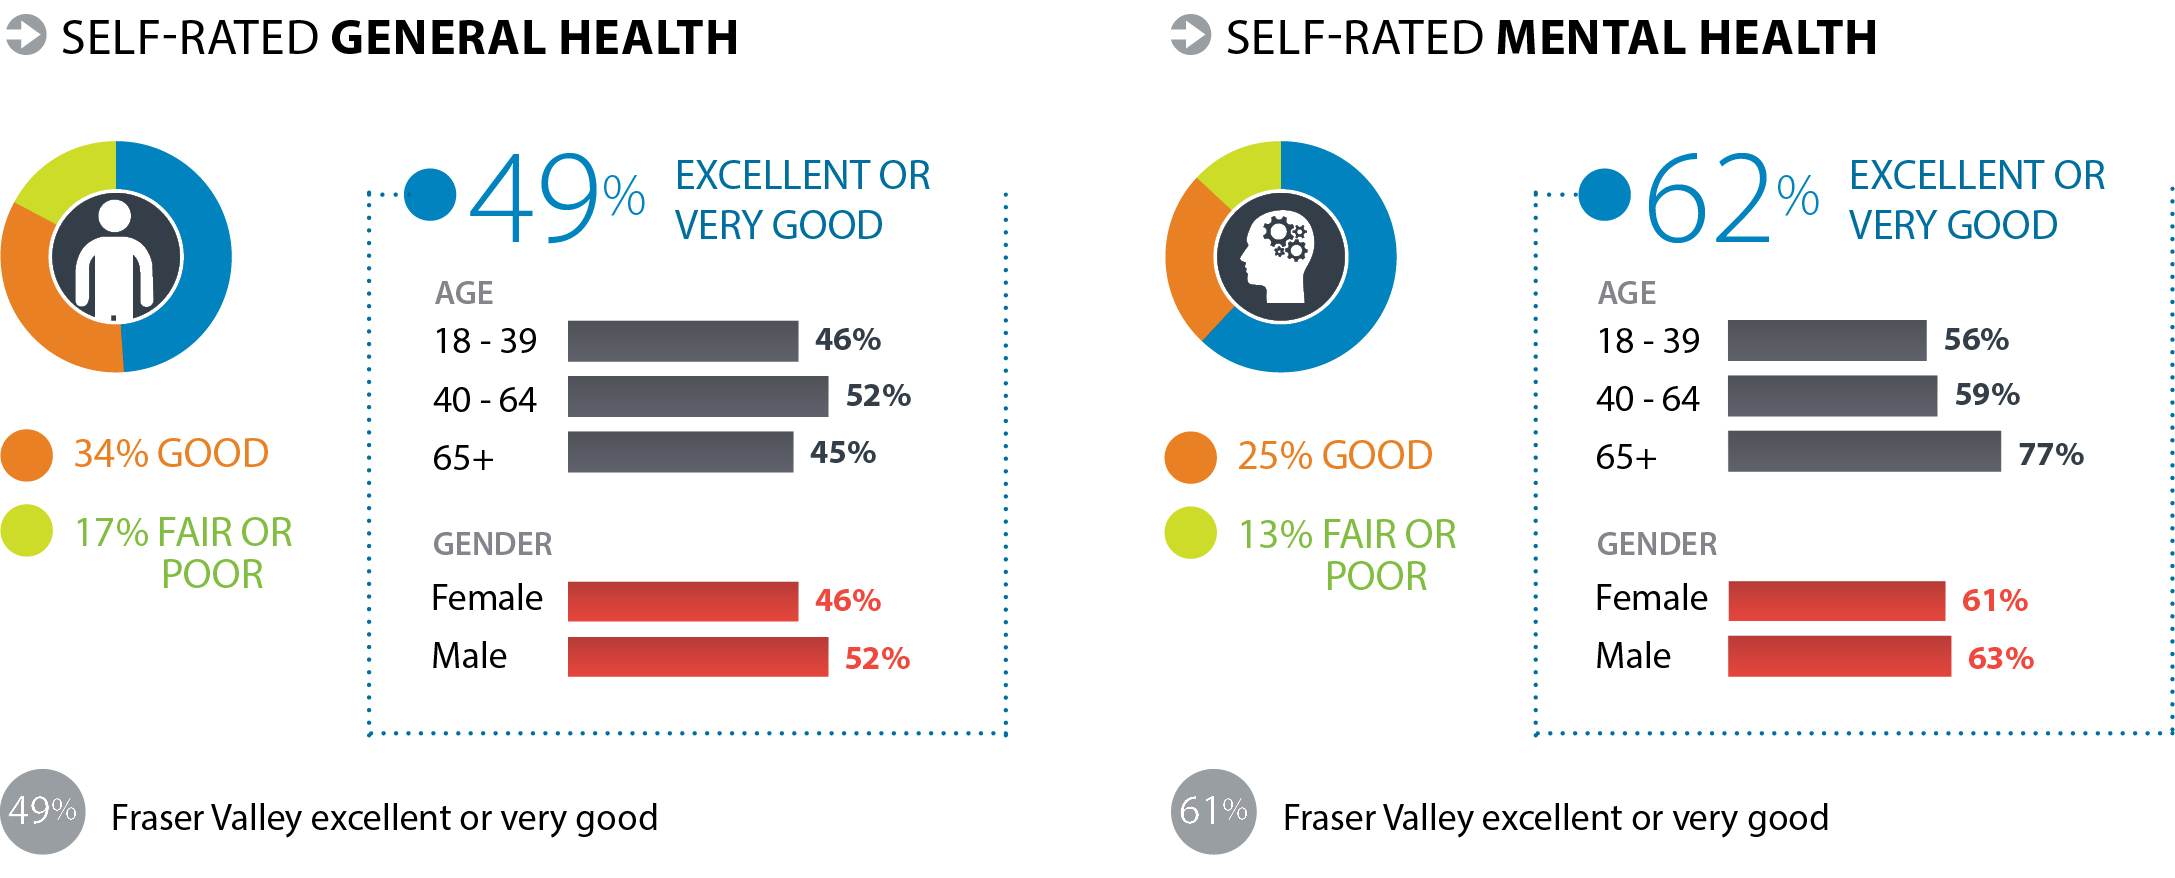
Across Fraser Valley
- Compared to those with less than high school education, reporting excellent or very good general health was 65% higher and excellent or very good mental health was 20% higher among university graduates.
- Compared to those with an annual household income below $40,000, reporting excellent or very good general health was 60% higher and excellent or very good mental health was 30% higher among those with annual income $120,000+.
Obesity
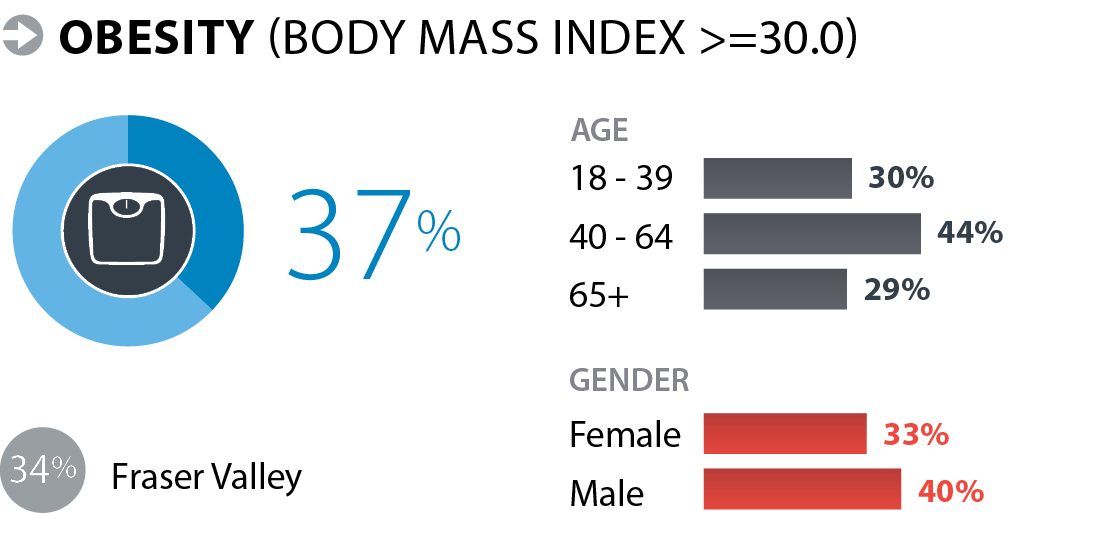
Across Fraser Valley
- Obesity was 30% lower among university graduates compared to those with less than high school education.
- Obesity was 30% lower among immigrants compared to Canadian born.
Self-reported Chronic Conditions
Chronic conditions are a major burden on our health care system, individuals, families and communities. Strategies to prevent chronic conditions include the development of policies and programs, at a community level, which encourage and enable healthy behaviours in order to reduce risk factors for chronic conditions.
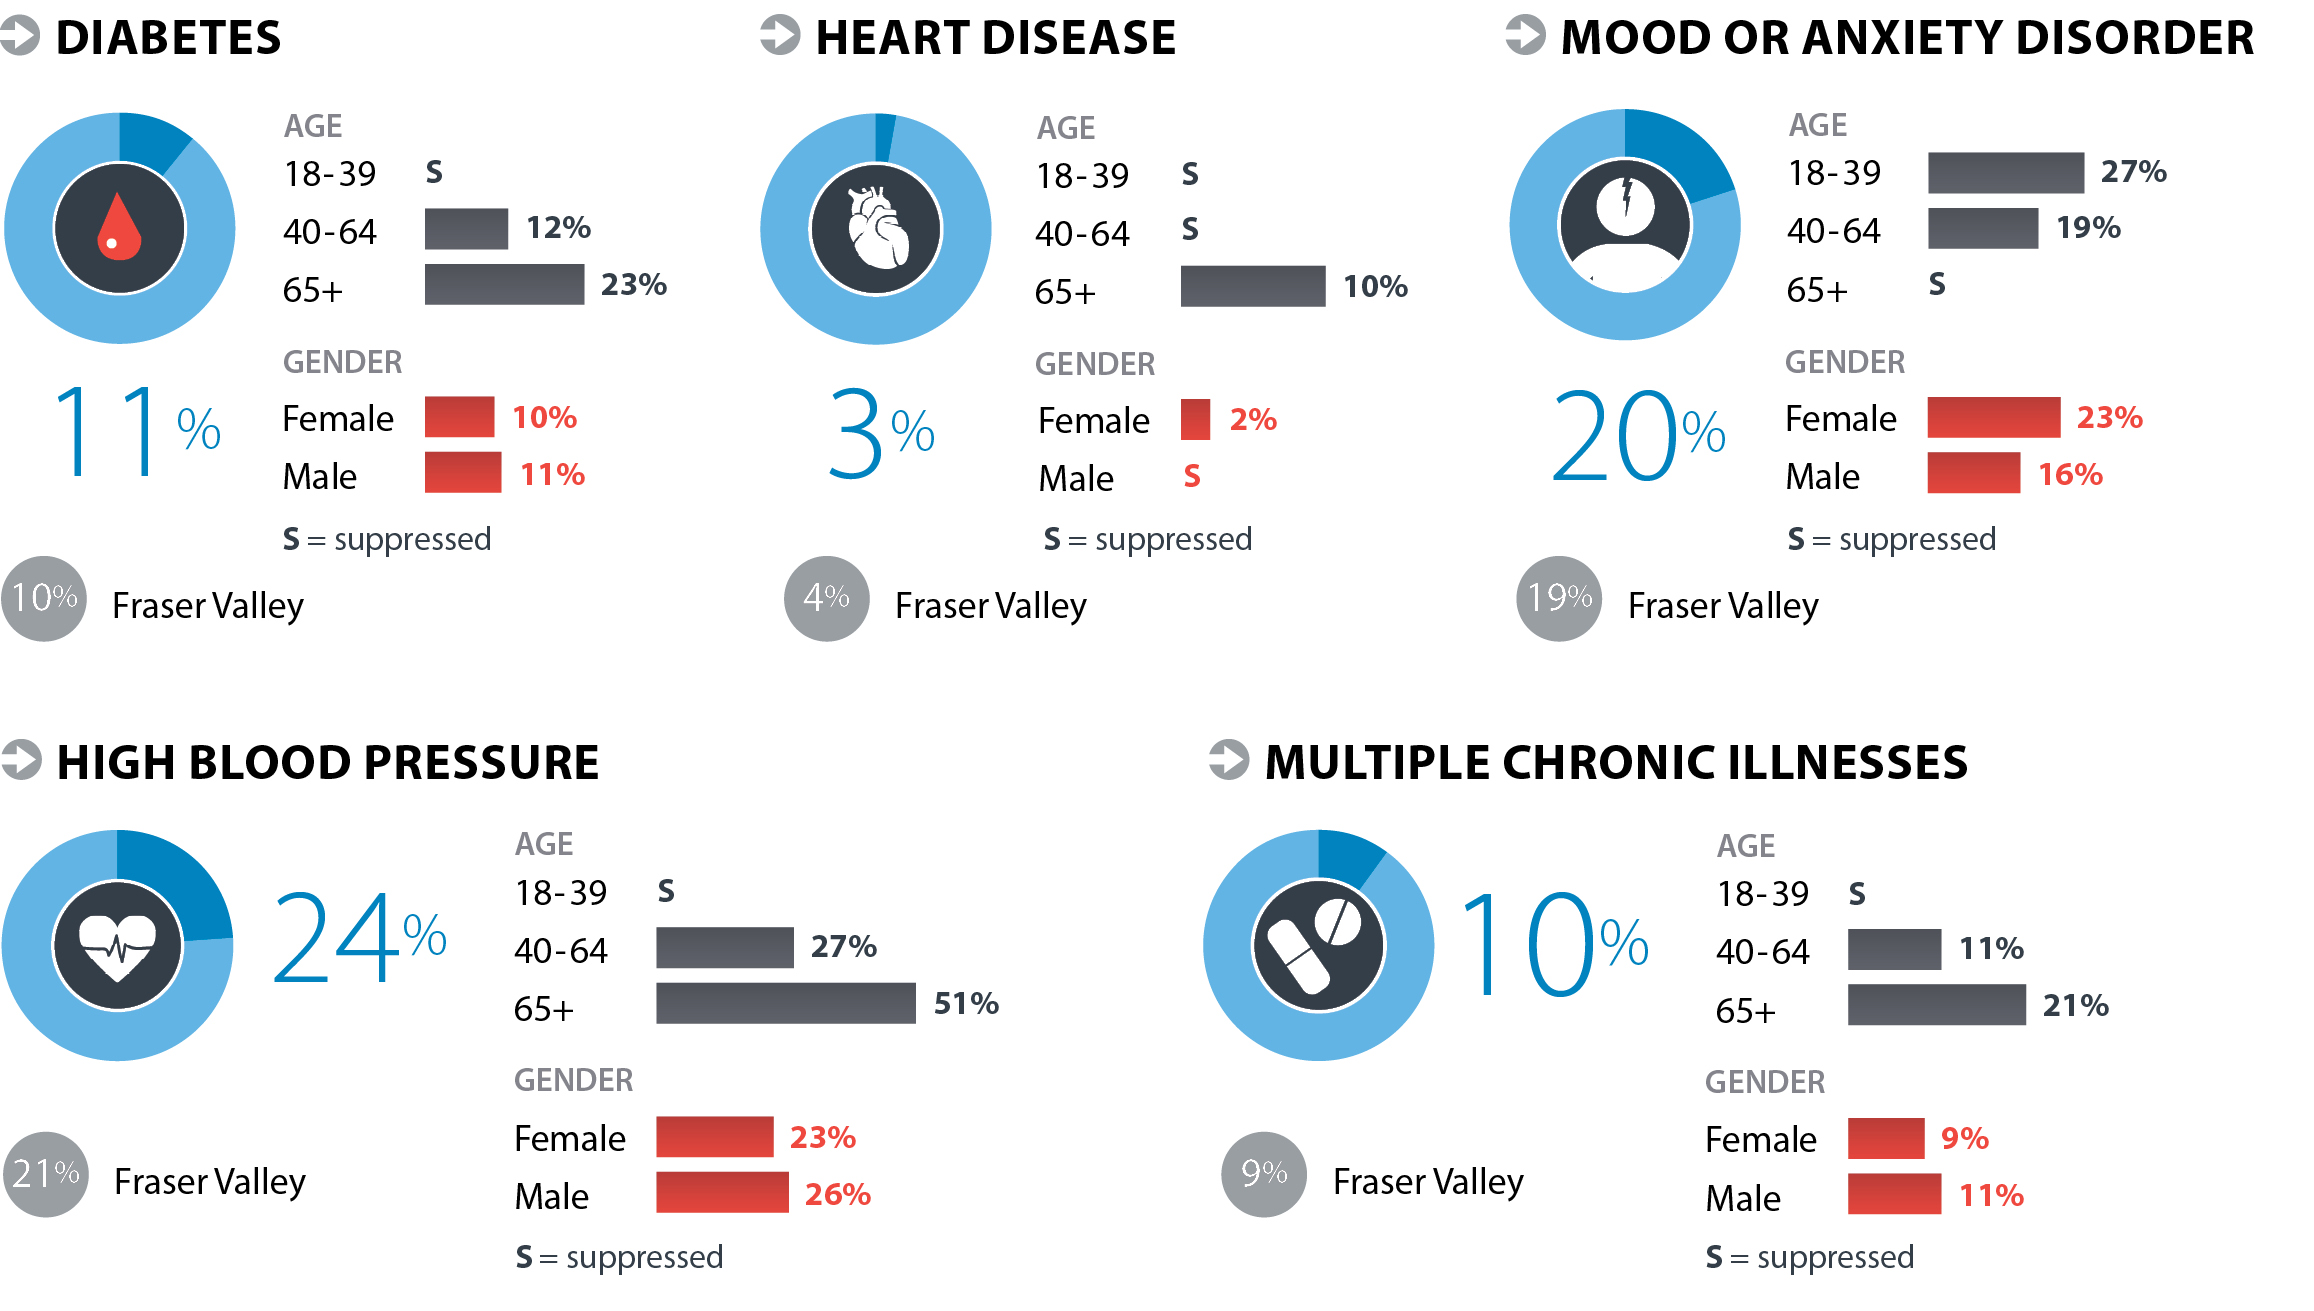
Across Fraser Valley
- Compared to those with an annual household income of $120,000+, diabetes was 6 times higher, high blood pressure was 2 times higher, mood and anxiety disorders were 2 times higher and multiple chronic conditions were 9 times higher among those with an annual household income of less than $40,000.
- Compared to university graduates, diabetes was 3 times higher, high blood pressure was 80% higher and multiple chronic conditions were 2.5 times higher among those with less than high school education.